
Spark is a performance profiling tool that gives you a detailed breakdown of where your server is spending its CPU time. It is the most accurate way to pinpoint what is causing lag - whether that is a plugin, entity processing, or a game mechanic running too often.
This guide covers how to install Spark, run a profiler session, read the results, and how to generate a Timings Report as a built-in alternative.
Step 1: Install Spark
- Head over to the Game Panel and stop your server.
- Navigate to Addons → Plugins, or Addons → Mods depending on which your version supports.
- Search for Spark and click Install.
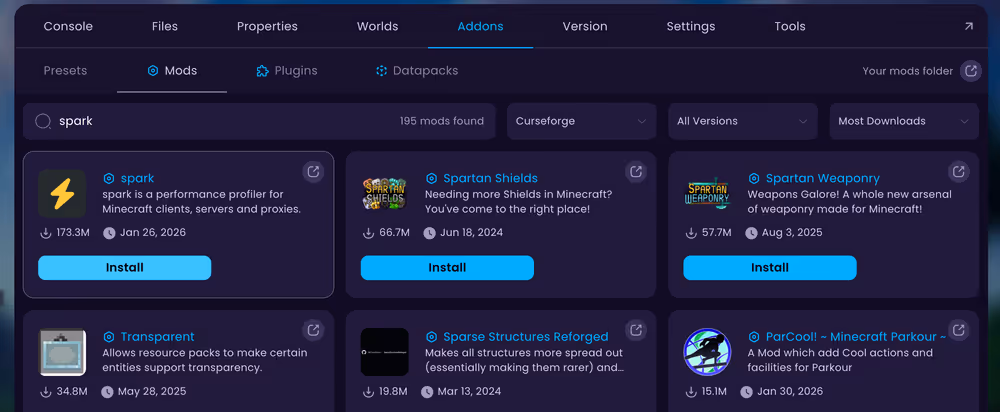
- Start your server and confirm Spark loads in the console.
Step 2: Run the Spark Profiler
- Head over to the Game Panel or join your server in-game.
- Run
/spark profiler startin the console or in-game chat.
- Wait at least 10 minutes for the profiler to collect enough data.
- Run
/spark profiler stopto end the session and generate a report link. - Click the link that appears in the console to open the report in your browser.
/spark profiler open instead. This generates a snapshot link without stopping the profiler.Step 3: Read the Spark Report
The report opens in your browser and displays a waterfall graph of your server's code execution. Focus on these key indicators at the top:
- TPS (Ticks per Second) - Should be 20.0. Values below 20 indicate the server is falling behind.
- MSPT (Milliseconds per Tick) - Should stay under 50ms. Higher values mean each tick is taking too long.
- CPU Usage - High system CPU can point to hardware-level bottlenecks rather than plugin issues.
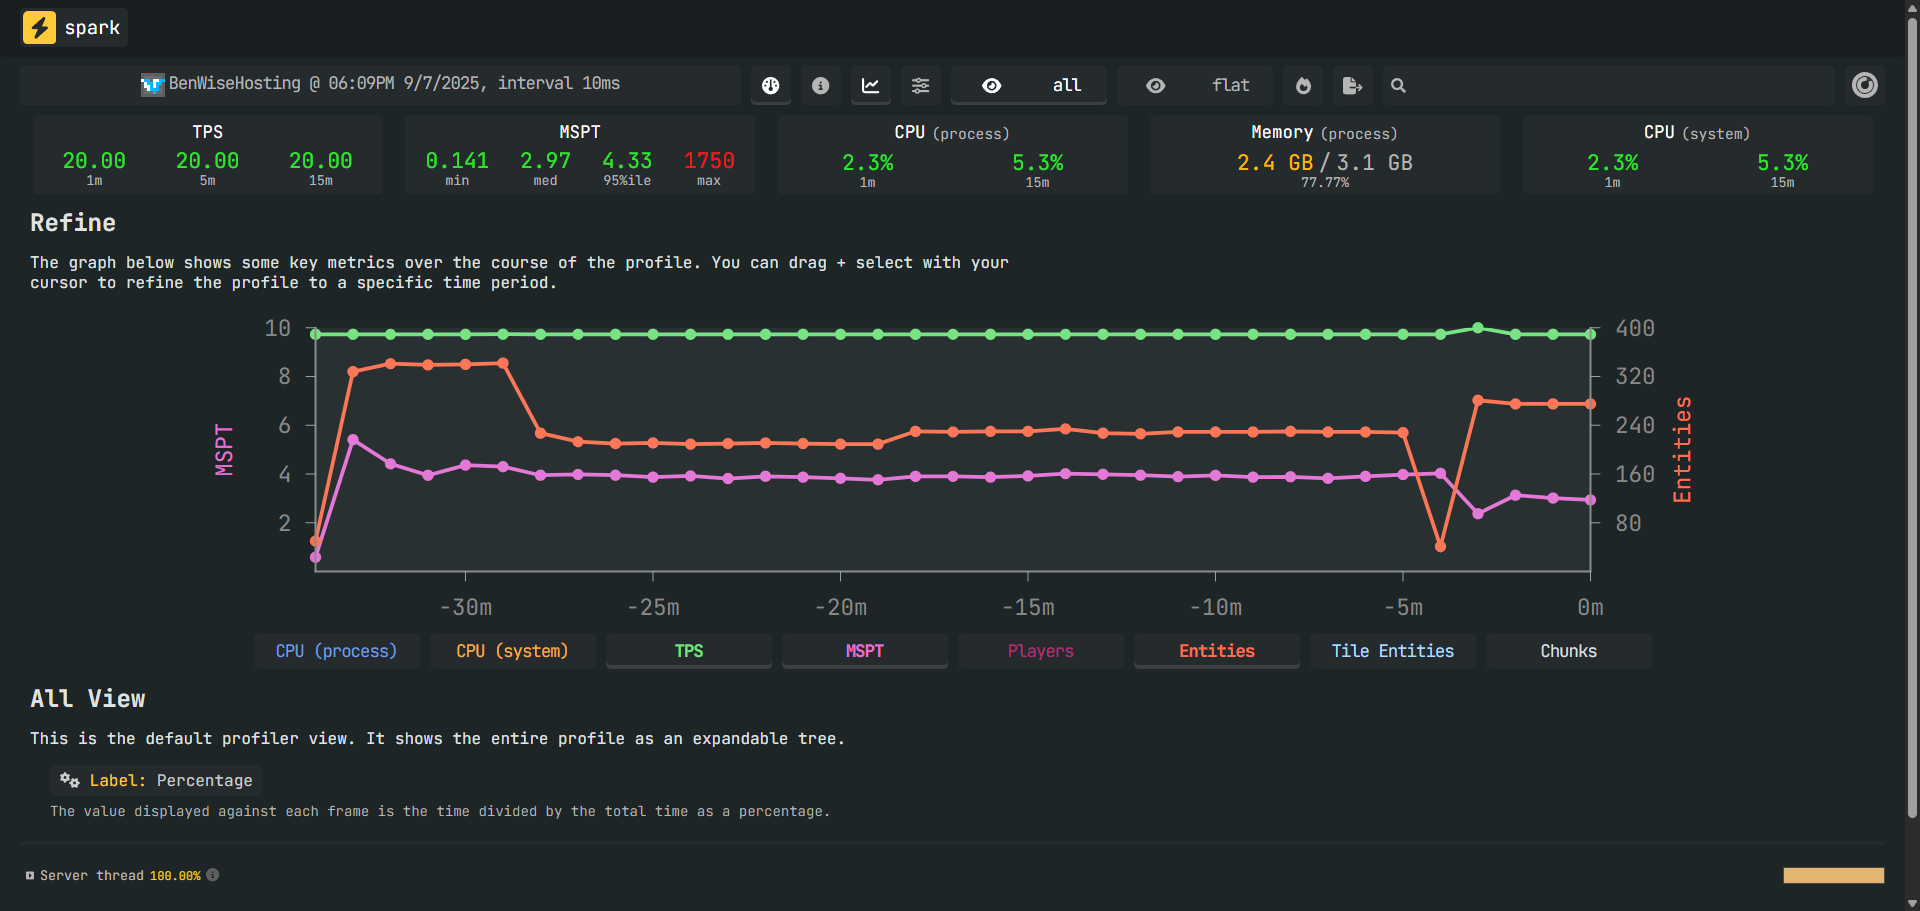
The waterfall graph lets you expand entries to drill down into what is slow. You can also switch between three view modes:
- All - Full waterfall view, best for detailed investigation.
- Flat - Flattened and sorted list, useful for spotting the heaviest code at a glance.
- Plugins - Filters results by plugin, helpful for identifying which plugins are contributing most to lag.
/spark profiler start --only-ticks-over 60 to filter out normal ticks and focus only on the slow ones.Analyze with a Spark Analyzer
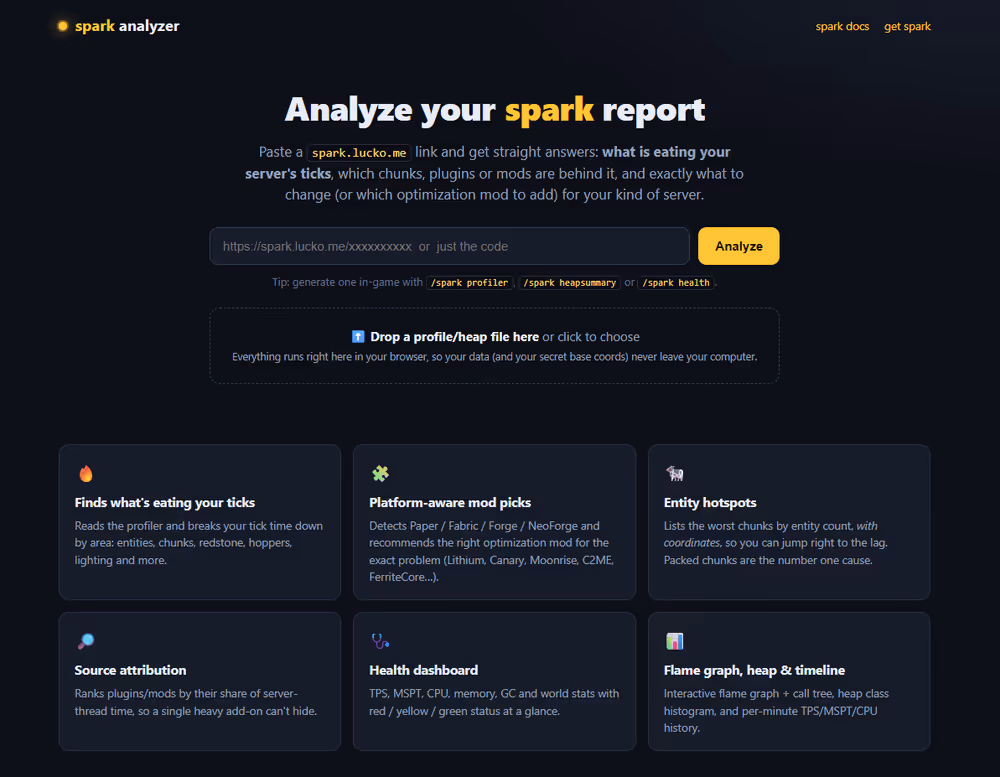
This tool has been created by WiseHosting Staff to help users analyze their Spark reports in an easily-understandable way.
How to Understand Spark’s Timing Report
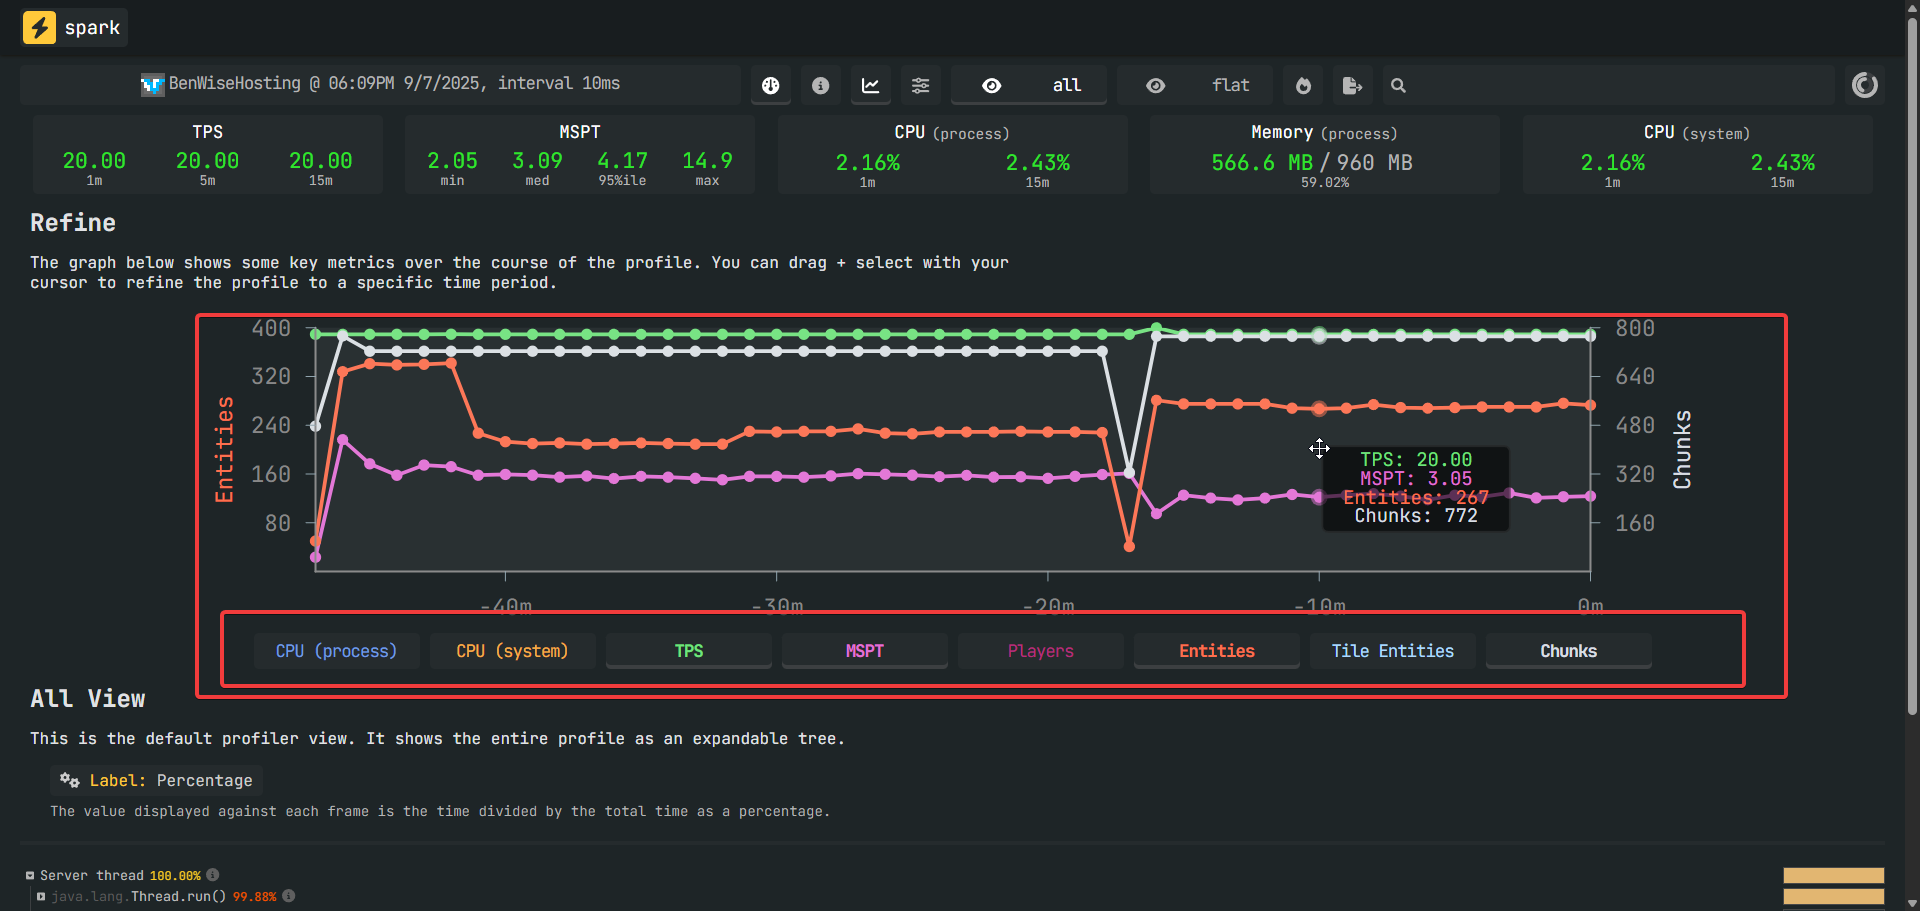
- The numbers at the top of the Report showcase the TPS (Ticks per second), MSPT (Milliseconds per tick), CPU process percentage, Memory usage, and CPU system percentage.
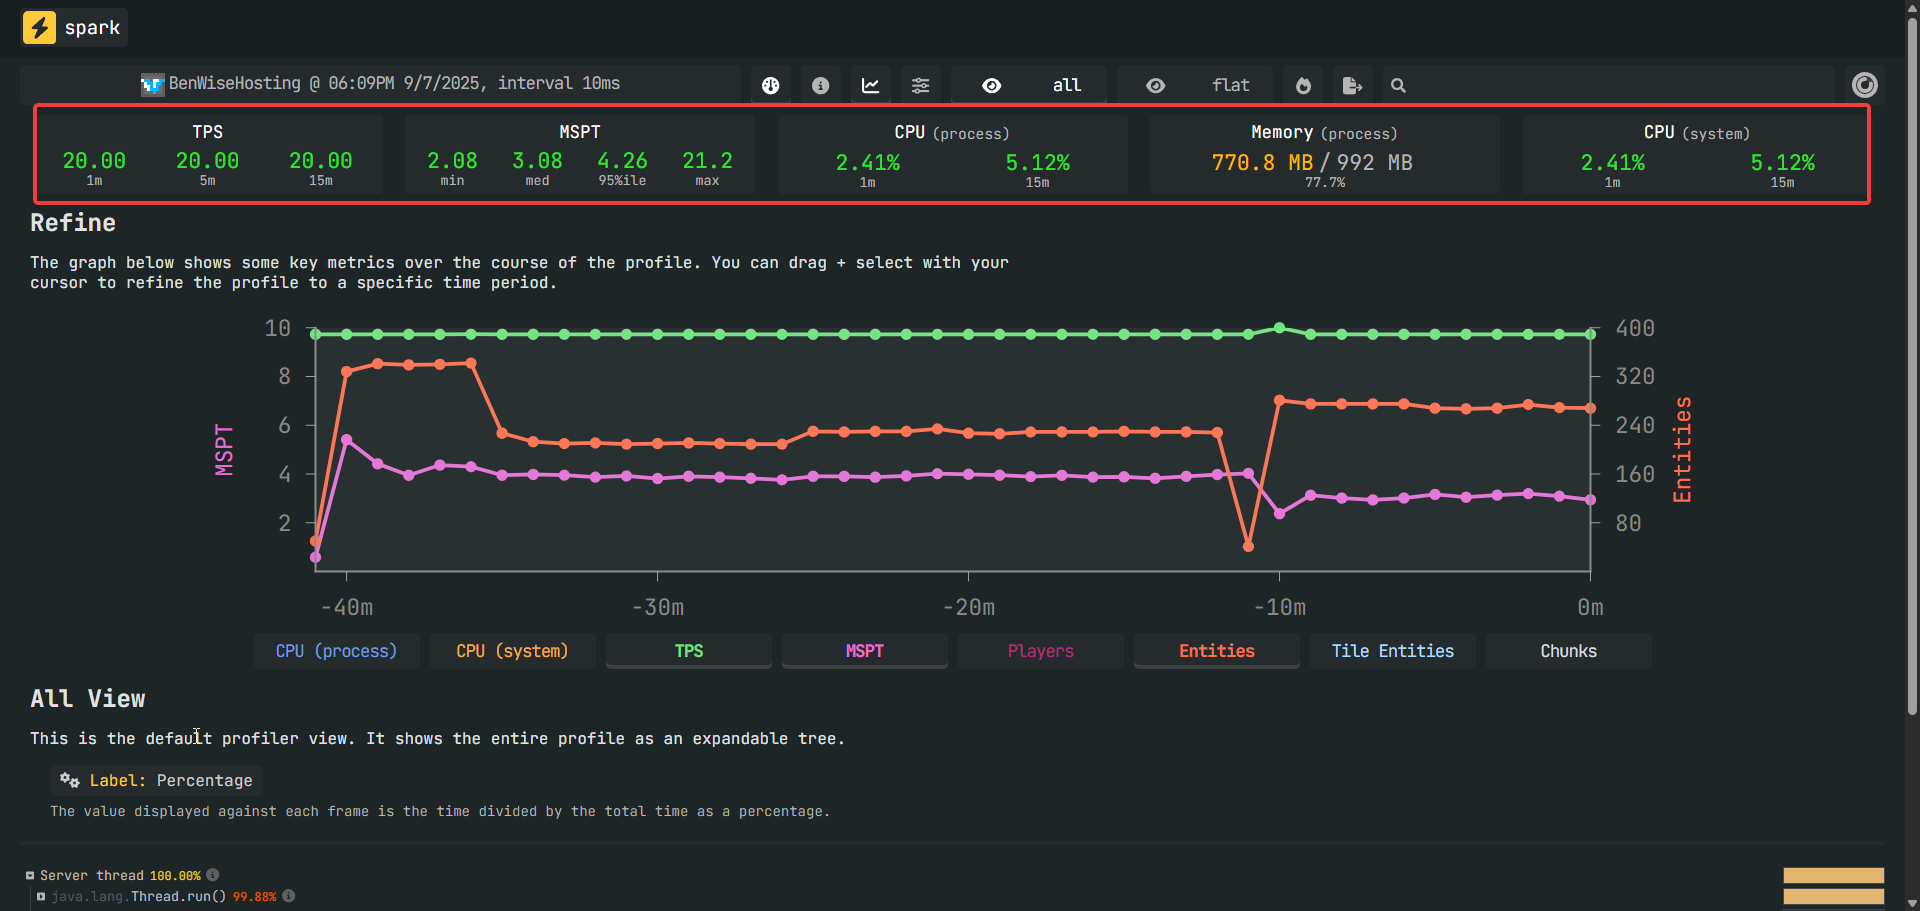
TPS (Ticks per second)
If the average TPS of your server is above 18, then the server isn’t experiencing any continuous lag.
MSPT (Milliseconds per tick)
If your MAX MSPT value is above 50, it means that your server is experiencing significant lag.
- The graph in the middle displays fluctuations in the values shown below the graph. When you hover over the graph, you will see how many entities or chunks are currently on the server. This graph allows us to identify the causes of lag, like high entity count or too many chunks loaded.
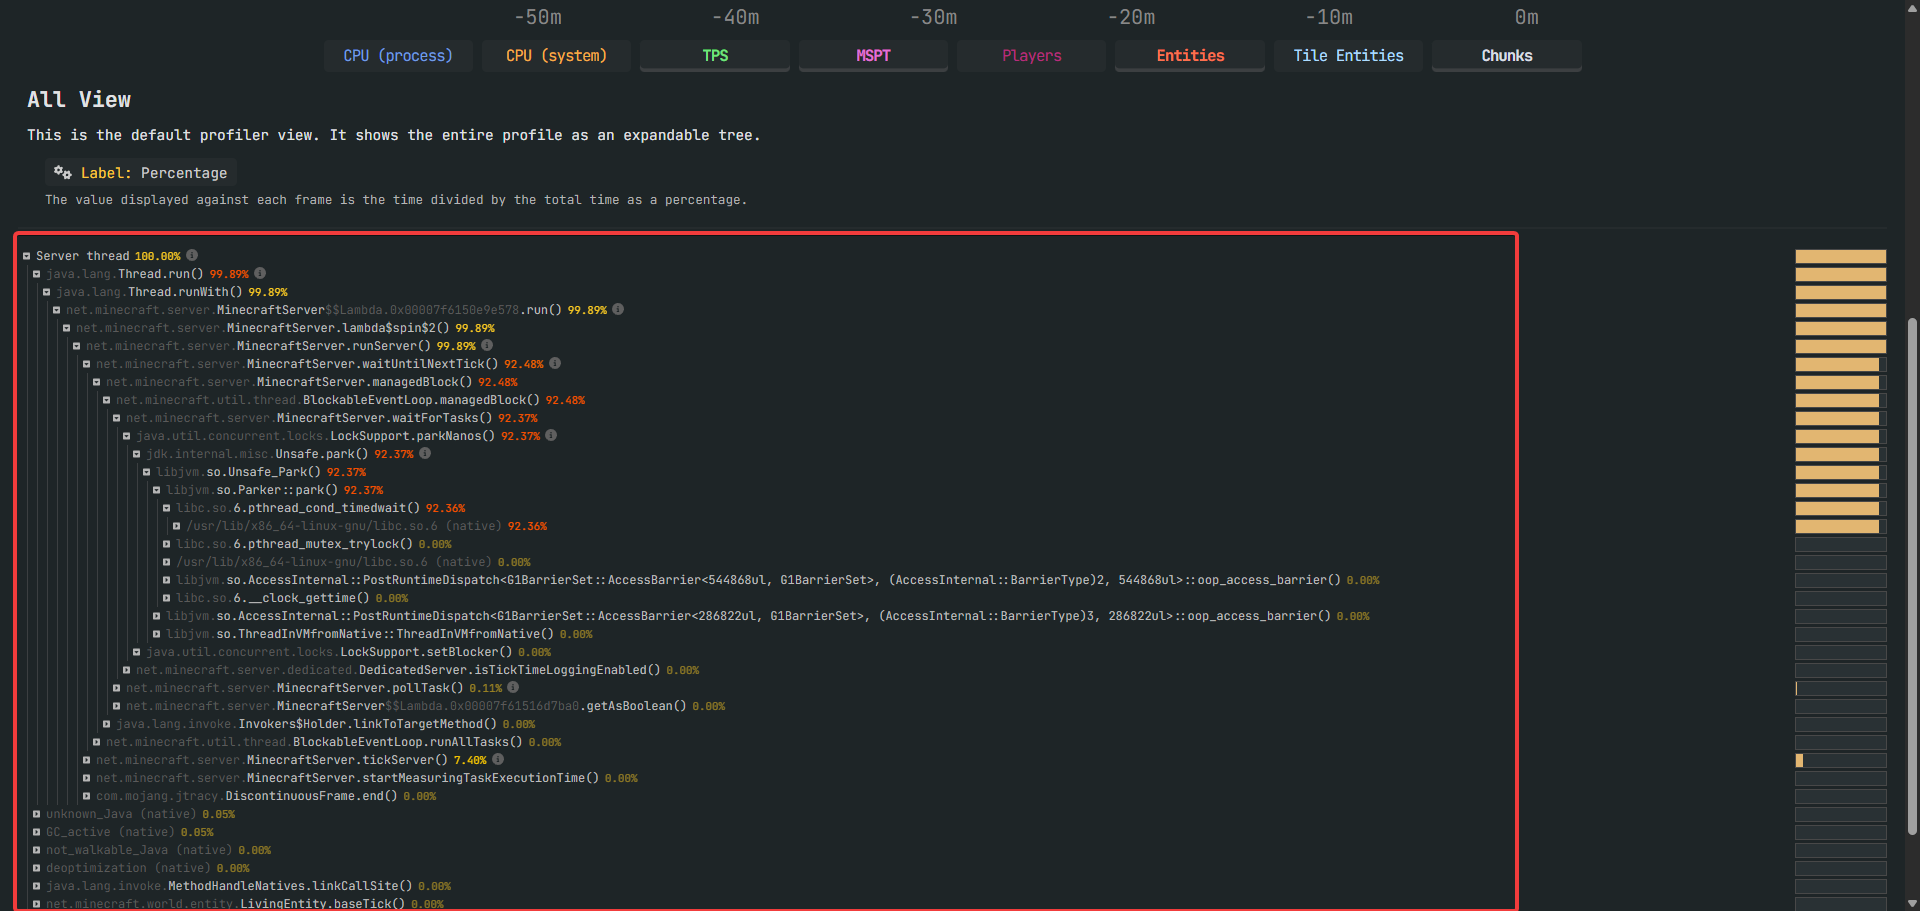
- When you scroll down to All View, you can see which processes are using the most of the server thread. This can be used to find what entity is causing the server to lag. It could be, for example, the cow entity.
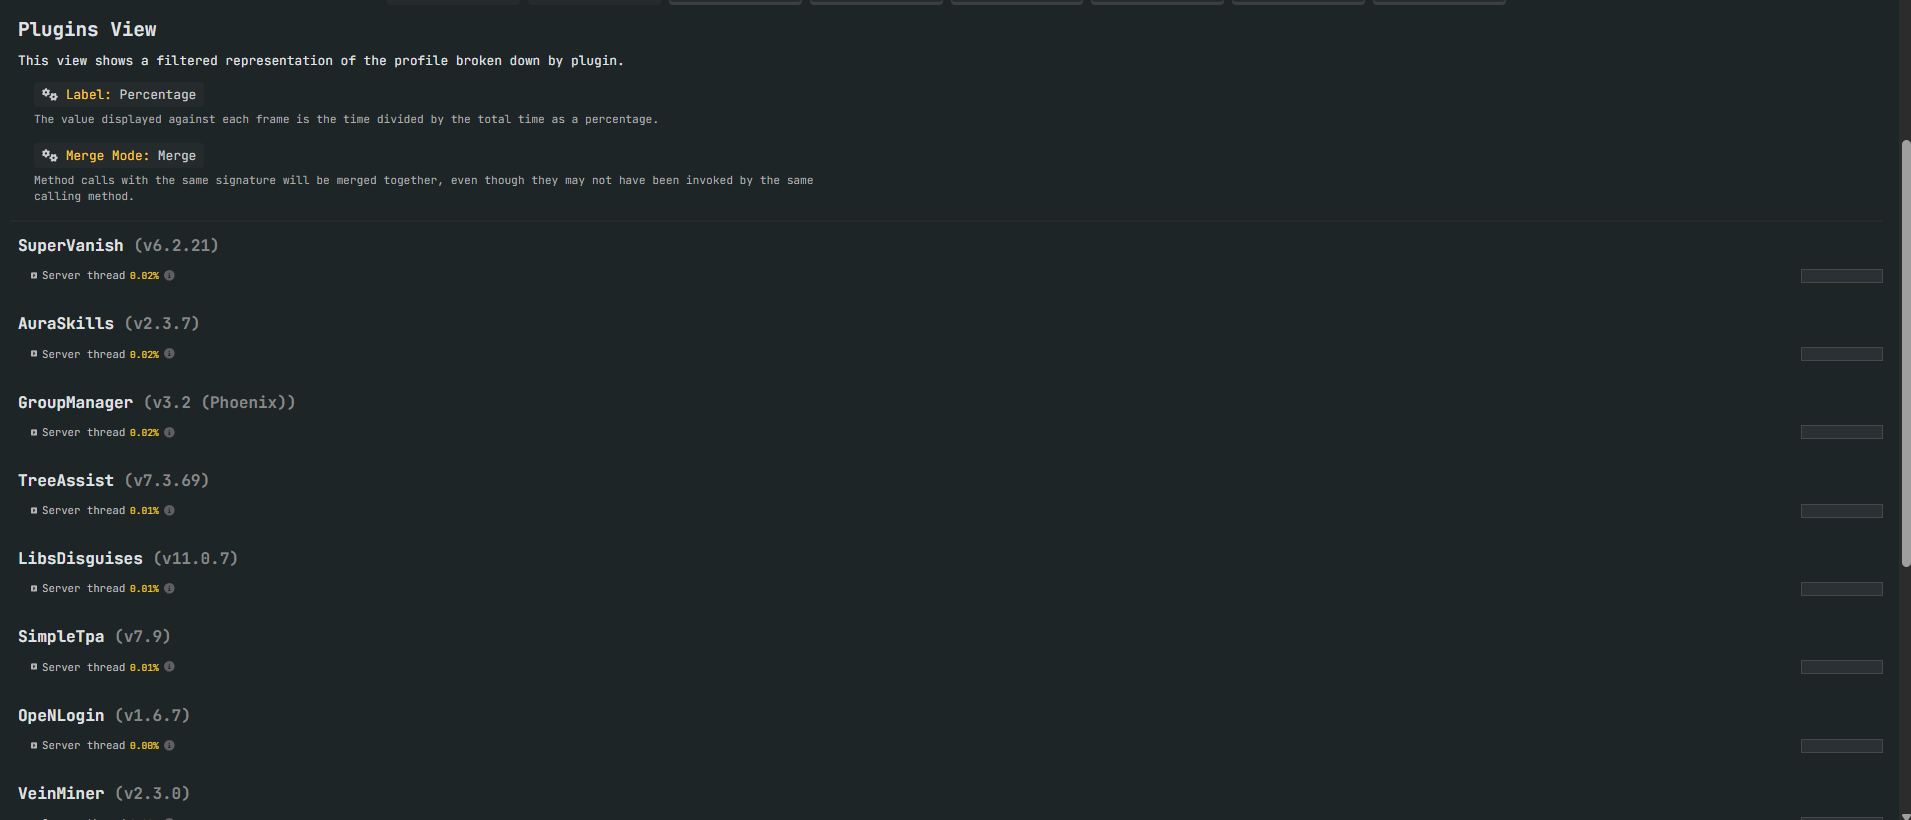
- If you have any plugins or mods installed on the server, there will be a plugins/mods tab visible.

- In the plugins/mods tab, you can see which plugin or mod is consuming the most of the server thread. This can help you identify and remove any heavy mods to reduce lag.
- If you are done viewing the Spark’s timing reports, then type
/spark profiler stopto stop the profiler.


